• Home
  • Features
  • Let’s Talk
Restaurant Systems – Restaurant Financial Automation SolutionsRestaurant Systems – Restaurant Financial Automation Solutions
  • Home
  • Features
  • Let’s Talk
Visual workflow showing how Restaurant Systems extracts invoice data and transforms it into structured, recipe-ready insights.
How we turn raw vendor invoices into usable, structured financial data — a sneak peek into our automation process.

Episode 1: The Tale of a US Foods Invoice – From Delivery to Data

April 12, 2025 Posted by Petros L. Invoice Automation

A 3D-rendered office desk with floating charts and data visualizations above a printed report.From Invoice to Insight is a four-part blog series that walks through how a humble US Foods invoice transforms into actionable restaurant dashboards. Each episode builds sequentially on the last – from capturing data, to cleaning it, to integrating everything, and finally visualizing insights. The tone is friendly and casual, aimed at demystifying tech for restaurateurs. Let’s dive in!

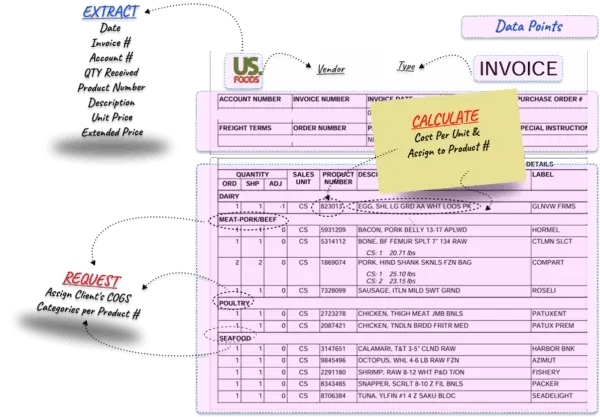
Imagine it’s Monday morning at your restaurant, and the delivery from US Foods just arrived. Along with the crates of fresh produce and proteins is a detailed multi-page invoice. If you’ve been in the restaurant game a while, you know the drill: this invoice holds critical information about what you bought and how much you spent. In the past, you might toss it in a drawer or spend tedious hours typing its contents into a spreadsheet. But today, we’re doing things differently. This post is Part 1 of our “From Invoice to Insight” series, where we’ll follow a US Foods invoice through a complete journey from raw paper (or PDF) all the way to actionable insights in a dashboard. Each episode builds on the last, so by the end, you’ll see how technology can turn that crinkled invoice into clear business intelligence – no data science degree required.

Camera Snaps a Picture of the invoice

Capturing Invoice Data Without the Headache: The first step in our journey is getting that invoice data out of the file cabinet and into a digital form we can work with. Fortunately, modern tools make this easier than ever. For example, Restaurant Systems (RS) offers a feature where you can simply email your invoice, and we will extract and categorize data instantly. No more manual retyping line by line – the vendor name, invoice number, date, and every line item (from 10 lbs of chicken breast to 2 cases of napkins) can be pulled into an Excel table or database with minimal effort. All the raw information on that US Foods invoice is now digitized and stored in a structured format, ready for analysis.

Visual workflow showing how Restaurant Systems extracts invoice data and transforms it into structured, recipe-ready insights.
 

An example US Foods invoice being processed digitally. Every relevant detail – vendor info, invoice number, dates, and line-item entries – can be captured automatically. Notice the line items grouped by category (Dairy, Meat/Pork/Beef, Poultry, etc.) and the highlighted fields like product codes and costs. Modern invoice processing tools identify these data points and convert them into a structured dataset. Instead of shuffling through papers, you get an Excel table (or database) of your purchases, neatly organized by date, vendor, and category in seconds.

Once the data is extracted, you essentially have a detailed log of all your purchases in a spreadsheet or database. For example, a single US Foods invoice might now be represented as dozens of rows, each row for a product you purchased, with columns like Invoice Date, Product Code, Description, Quantity, Unit, Unit Cost, and Total Cost. This is a goldmine of information. But in its raw form, it’s still just data. The next step is to refine this data so it actually makes sense for your restaurant’s tracking needs. Think of it like prepping ingredients in the kitchen: we’ve gathered everything from the pantry (i.e. captured the data), and now we need to wash, chop, and measure before we start cooking up insights. In Episode 2, we’ll dive into tidying up this data (with Excel/Power Query as our trusty knife) to get it ready for prime time.

Screenshot of raw invoice data before extraction, showing unstructured line items from a vendor bill.

Share this:

  • Click to share on Facebook (Opens in new window) Facebook
  • Click to share on LinkedIn (Opens in new window) LinkedIn
  • Click to share on X (Opens in new window) X
  • Click to print (Opens in new window) Print
  • Click to email a link to a friend (Opens in new window) Email

Like this:

Like Loading...
Tags: Invoice ProcessingPower BI DashboardsRestaurant AccountingRestaurant DataRestaurant Finance
Share
0

About Petros L.

Petros Lampropoulos is a restaurant operator, data analyst, and the founder of Restaurant Systems. With over 20 years of hands-on experience running restaurants in the U.S. and Greece, Petros now helps hospitality businesses turn messy invoices and scattered data into streamlined financial insights using Power BI, Microsoft 365, and custom automation.

You also might be interested in

Visual flowchart showing how restaurant data moves through different P&L categories using a custom dashboard.
This dashboard visualizes how product and invoice data is categorized and flows through your custom P&L system.

Episode 4: Visualizing Insights – Serving Up a Power BI Dashboard

Apr 18, 2025

Finally, we connect the dots by integrating your financial data with other business systems. This integration provides a comprehensive view of your operations, enabling real-time insights and more informed strategic planning.​

Visual showing the connection between sales, labor, and data in Power BI from Excel to Insight.
A snapshot of how Restaurant Systems integrates data from multiple sources like sales and labor into one intelligent Power BI dashboard.

Episode 3: Combining POS Sales, Labor, and More

Apr 17, 2025

With clean data in hand, we focus on mapping and categorizing it to align with your business structure. This episode demonstrates how to organize your financial data into meaningful categories, facilitating better tracking and decision-making.​

"Smoked salmon and avocado toast menu item with nutrition details"
"Featured breakfast item: Smoked Salmon and Avocado Toast."

Episode 2: From Raw Data to Recipe-Ready Data

Apr 16, 2025

Now that your invoices are digitized, it's time to clean and transform the data. We delve into how our system standardizes and categorizes your financial information, ensuring consistency and readiness for insightful analysis.

Recent Posts

  • Visualize Your Restaurant’s Finances with Custom Power BI Dashboards | Restaurant Systems
  • Episode 4: Visualizing Insights – Serving Up a Power BI Dashboard
  • Episode 3: Combining POS Sales, Labor, and More
  • Episode 2: From Raw Data to Recipe-Ready Data
  • Episode 1: The Tale of a US Foods Invoice – From Delivery to Data

Recent Comments

No comments to show.

Contact Us

Send us an email and we'll get back to you, ASAP.

Send Message
Unlock the power of Microsoft's AI platform today. Call Us Today!

Get started today.

Contact

  • Restaurant Systems
  • Wesley Chapel, Florida
  • 813 240 1109
  • petros@restaurantsystemsfl.com
  • www.rs-bi.com
  • @petrosfl

© 2025 · Restaurant Systems. Theme by HB-Themes.

  • Home
  • Features
  • Let’s Talk
Next
     

    Loading Comments...
     

      %d