• Home
  • Features
  • Let’s Talk
Restaurant Systems – Restaurant Financial Automation SolutionsRestaurant Systems – Restaurant Financial Automation Solutions
  • Home
  • Features
  • Let’s Talk
"Smoked salmon and avocado toast menu item with nutrition details"
"Featured breakfast item: Smoked Salmon and Avocado Toast."

Episode 2: From Raw Data to Recipe-Ready Data

April 16, 2025 Posted by Petros L. Invoice Automation

In Episode 1, we saw how quickly you can digitize your invoices with Microsoft Power Automate and AI Builder. But once those invoices become a neat table in Excel, what’s next? How do you turn raw invoice data into useful, actionable insights for your restaurant?

Screenshot of raw invoice data before extraction, showing unstructured line items from a vendor bill.

So, we’ve got our US Foods invoice data neatly captured in a spreadsheet – great! But as any chef knows, you can’t just throw raw ingredients into a pot and hope for a great dish. Preparation is key. In the data world, that means cleaning and transforming our raw invoice data so that it’s consistent, accurate, and ready to be analyzed. Think of this step as organizing your kitchen and prepping ingredients before the dinner rush: a bit of effort here makes everything that follows go smoothly.

Data Transformation 101: Using tools like Excel’s Power Query (or Power BI’s built-in Power Query editor), we can automate a lot of the cleanup. Here are some key transformations and fixes we apply to the invoice data:

  • Standardize and correct data: We fix inconsistencies in spelling, units, and formats. For example, ensure the vendor name is always recorded as “US Foods” (and not sometimes “U.S. Foods”), and that dates use a uniform format. If the invoice has quantity units like CS (case) or EA (each), we make sure those are interpreted consistently (we might translate them to full words or a standard unit of measure for clarity).

  • Calculate per-unit costs: In many invoices, you get a total price for a line item that represents multiple units (e.g. $120 for 24 bottles of olive oil). We add a calculation to derive the cost per single unit. In this example, $120/24 = $5 per bottle. This “cost per unit” metric is incredibly useful for comparing prices over time and is necessary if we want to link this data to recipe costs later. The RS system, for instance, captures the unit price of each product during this step as part of the extraction process​.

  • Assign categories: Each item gets tagged with an expense category that makes sense for your restaurant’s financial tracking. A case of chicken might be labeled Food – Poultry, milk would be Food – Dairy, and a box of garbage bags might go under Operating Supplies. By assigning a P&L category to every line, we ensure that when we later aggregate the data, every dollar falls into the right bucket (food cost, beverage cost, supplies, etc.)​ No more guessing whether “Brand X Bacon” is counted in Meat or Dairy – it’s defined upfront to match your chart of accounts.

  • Prep for Power BI: Finally, we structure the cleaned data for easy loading into our business intelligence tool. This means we end up with a nice flat table where each row is a purchase record and each column is a specific attribute (date, vendor, product, quantity, unit cost, total cost, category, etc.). It’s now in a format that a tool like Power BI can ingest directly. In fact, “we transform the raw dataset by standardizing fields, aligning formats, and prepping it for direct upload into Power BI”​ – exactly what we’ve done here.

 
A glimpse of the transformed data from our invoices. Here, each product from US Foods is listed with a clean product name, its purchase price, and a calculated cost-per-unit (Cost PU) in a common unit of measure. For instance, we can see items like Anchovy Fillet or Bagel Chips along with their unit costs standardized to ounces (Oz). By ensuring consistent units and computing unit prices for everything, we’ve made it easy to compare costs across products and across time. This organized table is now ready to feed into Power BI for further analysis.

After these transformations, our once-messy invoice data is looking clean and consistent. We’ve essentially turned a stack of purchase receipts into a well-organized dataset. Even better, this cleaning process can run automatically whenever new invoice data comes in (so each week when you get new US Foods invoices, you just drop them in and let the pre-set Power Query steps do the work). At this point, we’ve got what we bought and how much we paid, and each purchase is categorized properly.


Centralized database with vendor invoices.

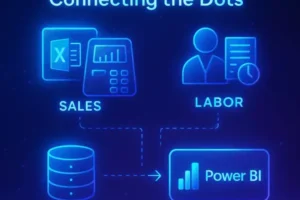
But on its own, purchase data only tells us half the story. To get true insight (not just a bunch of numbers), we need to blend this with other data from the restaurant. How do we know if the amount we spent on beef this month is reasonable? We’d have to compare it to how much beef we actually sold, right? That means it’s time to bring in sales data from the POS, and maybe even labor data, to complete the picture. Our costs are prepped and even uploaded into the BI system – as RS puts it, “from invoices to visuals…

Next up: connecting the POS to complete the picture.”​ In Episode 3, we’ll mix our polished purchase data with sales and labor info, integrating all the ingredients of our business into one stew of insight.

Share this:

  • Click to share on Facebook (Opens in new window) Facebook
  • Click to share on LinkedIn (Opens in new window) LinkedIn
  • Click to share on X (Opens in new window) X
  • Click to print (Opens in new window) Print
  • Click to email a link to a friend (Opens in new window) Email

Like this:

Like Loading...
Tags: Invoice ProcessingPower BI DashboardsRestaurant AccountingRestaurant DataRestaurant Finance
Share
0

About Petros L.

Petros Lampropoulos is a restaurant operator, data analyst, and the founder of Restaurant Systems. With over 20 years of hands-on experience running restaurants in the U.S. and Greece, Petros now helps hospitality businesses turn messy invoices and scattered data into streamlined financial insights using Power BI, Microsoft 365, and custom automation.

You also might be interested in

Smart Process for Restaurant Business Intelligence — Invoice Digitization, POS Integration, Real-Time Dashboards, Financial Forecasting
See how Restaurant Systems evolves your financial operations with a smart, step-by-step process — from invoice digitization to real-time forecasting dashboards.

Visualize Your Restaurant’s Finances with Custom Power BI Dashboards | Restaurant Systems

Apr 29, 2025

Stop wasting hours on invoice chaos. We created a 4-step system that digitizes your restaurant’s financials and turns them into clean, live dashboards — no QuickBooks required. 📊 Automate invoices 📈 Get real-time reports 🧠 Make smarter, faster decisions 👉 Check out our full blog and see how it works.

Visual showing the connection between sales, labor, and data in Power BI from Excel to Insight.
A snapshot of how Restaurant Systems integrates data from multiple sources like sales and labor into one intelligent Power BI dashboard.

Episode 3: Combining POS Sales, Labor, and More

Apr 17, 2025

With clean data in hand, we focus on mapping and categorizing it to align with your business structure. This episode demonstrates how to organize your financial data into meaningful categories, facilitating better tracking and decision-making.​

Visual flowchart showing how restaurant data moves through different P&L categories using a custom dashboard.
This dashboard visualizes how product and invoice data is categorized and flows through your custom P&L system.

Episode 4: Visualizing Insights – Serving Up a Power BI Dashboard

Apr 18, 2025

Finally, we connect the dots by integrating your financial data with other business systems. This integration provides a comprehensive view of your operations, enabling real-time insights and more informed strategic planning.​

Recent Posts

  • Visualize Your Restaurant’s Finances with Custom Power BI Dashboards | Restaurant Systems
  • Episode 4: Visualizing Insights – Serving Up a Power BI Dashboard
  • Episode 3: Combining POS Sales, Labor, and More
  • Episode 2: From Raw Data to Recipe-Ready Data
  • Episode 1: The Tale of a US Foods Invoice – From Delivery to Data

Recent Comments

No comments to show.

Contact Us

Send us an email and we'll get back to you, ASAP.

Send Message
Unlock the power of Microsoft's AI platform today. Call Us Today!

Get started today.

Contact

  • Restaurant Systems
  • Wesley Chapel, Florida
  • 813 240 1109
  • petros@restaurantsystemsfl.com
  • www.rs-bi.com
  • @petrosfl

© 2025 · Restaurant Systems. Theme by HB-Themes.

  • Home
  • Features
  • Let’s Talk
Prev Next
     

    Loading Comments...
     

      %d