Up to now, we’ve been laser-focused on the invoices and purchase costs. But a restaurant doesn’t run on purchases alone – we need to see how those purchases relate to the business’s other numbers, especially sales and labor. This is the step where everything comes together. Think of it like combining all the prepared ingredients into a single dish: our costs, sales, and other data get mixed so we can taste the final result (the insight!).
Bringing in POS (Sales) Data: First, we connect the sales data from your point-of-sale system to our invoice data. If you’re using a popular POS system (Toast, Square, Aloha, etc.), you likely have daily reports of your sales, maybe broken down by category (food vs. drinks) or even by menu item. Rather than punching that in manually, our system links to these reports directly, so the data flows in without you lifting a finger. Once integrated, we have a record of how much revenue you made each day, and even exactly what menu items you sold. This is crucial: now we can start asking, Did my $5,000 of food purchases last week translate into an appropriate amount of sales? If we see $15,000 in food sales for that week, we can compute that food cost percentage. If sales were only $8,000, we know something’s off. By aligning purchases with sales, metrics like Cost of Goods Sold (COGS as a % of sales) become available instantly.

Don’t Forget Labor: For a complete picture of restaurant operations, we also integrate labor data – typically, how many hours your staff worked and what that cost in wages. Many POS systems or scheduling apps have this info, or you might get it from payroll reports. Either way, plugging labor into our data model lets us monitor another huge cost driver in context. With sales and labor tracked side by side, you can spot patterns like “Did we staff too heavily on Monday lunch? Are we hitting our target labor percentage?” In fact, by comparing sales and labor in near real-time, some operators adjust staffing on the fly – cutting a shift early if sales are slow, for example – to control costsrs-bi.com. Our integrated dataset supports that level of agility; you’ll see labor dollars vs. sales dollars at a glance, any time period you want.
Bringing in POS (Sales) Data: First, we connect the sales data from your point-of-sale system to our invoice data. If you’re using a popular POS system (Toast, Square, Aloha, etc.), you likely have daily reports of your sales, maybe broken down by category (food vs. drinks) or even by menu item. Rather than punching that in manually, our system links to these reports directly, so the data flows in without you lifting a finger. Once integrated, we have a record of how much revenue you made each day, and even exactly what menu items you sold. This is crucial: now we can start asking, Did my $5,000 of food purchases last week translate into an appropriate amount of sales? If we see $15,000 in food sales for that week, we can compute that food cost percentage. If sales were only $8,000, we know something’s off. By aligning purchases with sales, metrics like Cost of Goods Sold (COGS as a % of sales) become available instantly.

The Recipe Connection: Now for the really clever part – linking your purchases to what you’re selling on the menu. We touched on calculating per-unit costs in the last episode; here’s where that pays off. Using recipe mapping, we connect the dots between the ingredients (from invoices) and the menu items that use them. For instance, imagine your menu includes a Grilled Chicken Caesar Salad. That salad’s recipe might use 8 ounces of chicken, 2 ounces of dressing, 5 ounces of lettuce, etc. With recipe mapping, we associate each of those ingredients to the salad in our data model, along with the portion size. Why go through this trouble? Because it lets us do two powerful things:
Calculate Plate Costs: We can calculate exactly how much one Chicken Caesar Salad costs to make, using the latest prices from the invoices. If chicken or lettuce got more expensive this month, you’ll see it reflected in the salad’s cost. Say the salad sells for $12 and, based on current ingredient prices, it costs $4 to make – that’s a 33% food cost for that dish. We can see that margin and track it over time.
Compare Usage vs. Purchases: By knowing the recipe portions and how many salads we sold (from the POS data), we can compute how much chicken we should have used. If we sold 100 salads, that’s 800 oz (50 lbs) of chicken needed. We can then compare that to what the invoices say we actually purchased. Suppose we bought 60 lbs of chicken for that period; roughly 50 lbs went into sales, and maybe ~10 lbs accounted for prep trim or extra inventory – that sounds reasonable. But if we had purchased 100 lbs and only needed 50, we likely over-ordered or wasted a lot – and the data will highlight that discrepancy.

Recipe mapping essentially marries the invoice world with the menu world. It gives context to your purchases. Restaurant Systems emphasizes this capability because it means you can “know the cost of every plate before it leaves the kitchen,” with ingredient prices updating in real time. In other words, you’re not guessing your food cost on each dish – you know it, and you can price menu items confidently or tweak recipes to maintain margins. Moreover, “product numbers are mapped to recipes with exact portions, units, and pricing”, enabling real-time food cost tracking and profit margin calculations at the menu-item level. This is advanced stuff, but incredibly valuable for fine-tuning your operations and spotting issues early.
Calculate Plate Costs: We can calculate exactly how much one Chicken Caesar Salad costs to make, using the latest prices from the invoices. If chicken or lettuce got more expensive this month, you’ll see it reflected in the salad’s cost. Say the salad sells for $12 and, based on current ingredient prices, it costs $4 to make – that’s a 33% food cost for that dish. We can see that margin and track it over time.
Compare Usage vs. Purchases: By knowing the recipe portions and how many salads we sold (from the POS data), we can compute how much chicken we should have used. If we sold 100 salads, that’s 800 oz (50 lbs) of chicken needed. We can then compare that to what the invoices say we actually purchased. Suppose we bought 60 lbs of chicken for that period; roughly 50 lbs went into sales, and maybe ~10 lbs accounted for prep trim or extra inventory – that sounds reasonable. But if we had purchased 100 lbs and only needed 50, we likely over-ordered or wasted a lot – and the data will highlight that discrepancy.

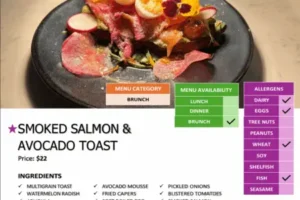
💡 Bonus Value: At Restaurant Systems, we don’t just calculate the cost of your recipes—we take it a step further. We provide a visually rich menu guide that not only breaks down ingredients, portions, and plate cost, but also includes images of each dish. These guides double as training tools for your kitchen and front-of-house teams, ensuring consistency in preparation, presentation, and communication. It’s a cost control asset and a staff onboarding tool all in one.
Recipe mapping essentially marries the invoice world with the menu world. It gives context to your purchases. Restaurant Systems emphasizes this capability because it means you can “know the cost of every plate before it leaves the kitchen,” with ingredient prices updating in real time. In other words, you’re not guessing your food cost on each dish – you know it, and you can price menu items confidently or tweak recipes to maintain margins. Moreover, “product numbers are mapped to recipes with exact portions, units, and pricing”, enabling real-time food cost tracking and profit margin calculations at the menu-item level. This is advanced stuff, but incredibly valuable for fine-tuning your operations and spotting issues early.

An example of recipe-level cost integration. Here we see ingredients (like Balsamic Glaze, Grilled Bread, Burrata, Celery Leaf, EVOO, Pancetta, etc.) that go into a menu item, each with a defined portion and unit cost (PPU). The system calculates the total recipe cost for that dish (in this example, about $4.25), and compares it to the menu price (here, $18.00) to compute a recipe cost percentage (~23.6% for this dish). By mapping each ingredient from the invoice to specific recipes, the dashboard can show exactly how much each menu item costs to make and what your profit margin is. If an ingredient’s price changes, the recipe cost updates automatically, so you’re always up-to-date on each dish’s profitability.
With purchases, sales, recipes, and labor data all integrated, we’ve built a complete picture of the restaurant’s financial ecosystem. This unified dataset allows us to answer the big questions that keep owners up at night. Here are just a few insights we can now unlock (and pain points we solve) thanks to our integrated data:
📊 Track Food Cost Percentage: Instantly calculate your food cost as a percentage of sales for any given period. Monitoring this weekly (or even daily) means no surprises at month-end; you’ll know if you’re trending high and can take action early (like adjusting menu prices or portions, or tightening up ordering).
📈 Catch Vendor Price Fluctuations: Because we have historical invoice data tied in, you can see if a vendor’s prices are creeping up. For example, if the cost of cheese from US Foods jumped from $50 a case to $60 a case over two months, the system will make that visible. You might notice your Margherita Pizza now costs 5% more to make than it did last month. These insights let you negotiate with vendors or find alternatives, and ensure your menu pricing keeps pace with actual costs.
🚫 Prevent Over-Ordering and Waste: By comparing theoretical ingredient usage (from recipes) to actual purchases, the system can flag discrepancies. If you consistently buy 20% more beef than what your sales indicate you needed, that’s a red flag. It could mean over-ordering or excessive waste (or even theft). With this knowledge, you can adjust order quantities or improve inventory practices to tighten up losses and keep your purchasing efficient.
🕒 Optimize Labor Usage: Since labor hours/costs are integrated, you can measure labor as a percentage of sales (another key part of the “prime cost” in restaurants). For instance, you might discover your labor cost was 25% of sales last week – a bit above your target of, say, 22%. Digging in, maybe weekends are fine but Mondays are high because you schedule extra prep staff. These insights help with scheduling decisions. As RS notes, leveraging this info lets you “make daily adjustments to your strategy” to stay within budget and maximize profitability – for example, trimming a shift on a slow day or rearranging duties to do more with a smaller team.
At this point, all our data “dots” are connected – we haven’t just collected data in isolation, we’ve linked it together to see the whole story. (In the words of RS, “We Don’t Just Collect the Dots — We Connect Them.”) This comprehensive dataset is the foundation for powerful analysis.
Now it’s finally time for the fun part: visualizing these insights. In the final episode, we’ll take this integrated data and build a dashboard in Power BI that brings your restaurant’s story to life, from cost trends to performance metrics.